Art of BI: OBIEE 11.1.1.9 First Look – Customize Graphs and Charts in OBIEE 11.1.1.9
Author: Christian Screen | 9 min read | October 21, 2015
In this part of the OBIEE 11.1.1.9 series, I’ll take a look at how to customize graphs and charts in OBIEE 11.1.1.9. As we’ve discussed, the idea of the 11.1.1.9 release appears to be drawing Oracle BI customers closer to what the architecture will be in the future Oracle BI 12c release(s), so this release is a good stepping stone in the right direction.
Customers of Oracle BI 10g or 11g who have modified their look and feel, particularly with graphs colors will find that there is no upgrade path available for applying their existing custom color palette to OBIEE 11.1.1.9 and let’s assume the same applies for future releases of 12c.

To begin a net new, or an “upgrade”, of a custom color palette for your Oracle BI system to OBIEE 11.1.1.9, the high-level steps to follow are:
1. Get the Custom Color Palette Hex Code Colors
2. Copy the OBIEE 11.1.1.9 customization EAR file
3. Customize the new graph.xml file for the new customization folder structure
4. Copy the Extracted WAR file folder to the /analyticsRes location on our OBIEE system
5. Deploy analyticsRes to WebLogic, if not already deployed
6. Update the instanceConfig.xml file for the OBIEE server
7. Restart the OBIEE Services (via OPMNCtl or Enterprise Manager)
8. Verify your customization changes by creating new chart or graph
Get the Custom Color Palette
The default OBIEE color palette is nice but as a modern organization there is most likely a corporate color scheme which we’d rather apply. As such these are typically found in the marketing department or with the company’s logo standardization documentation. If upgrading and you’ve already been using custom graph colors then simply use the Hex Code colors associated with the dvt-graph.xml file. For those just testing or looking for a net new color scheme, try one of our favorite sites, https://coolors.co/, which will allow you to test a few color options and will provide a full 5-color index to work with. We’ve chosen the later for this blog post with the resulting hex codes.
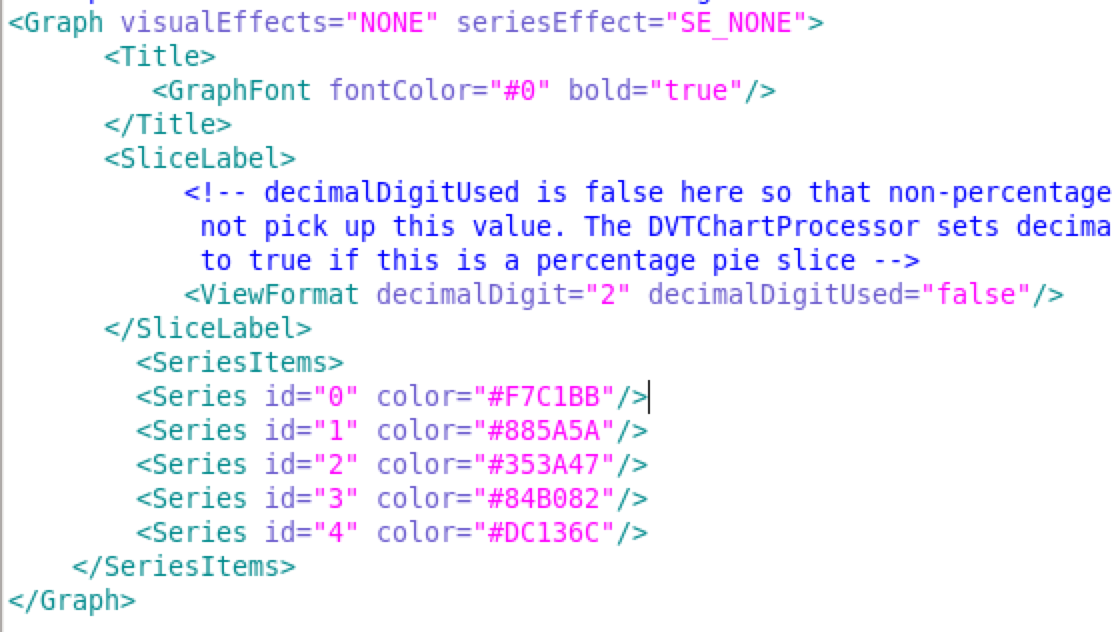
Color 1: #F7C1BB
Color 2: #885A5A
Color 3: #353A47
Color 4: #84B082
Color 5: #DC136C
In previous versions of OBIEE the custom graph file allowed a maximum of between 7-12 colors. OBIEE 11.1.1.9 now allows more colors from the custom palette to be used.
For now, just make sure that you jot down your color hex codes as we have done above.
Copy the OBIEE 11.1.1.9 customization EAR Folder
OBIEE 11.1.1.9, and let’s assume all future versions of OBIEE, will now attempt to make our lives easier by giving us a centralized process for migrating our customizations. The new version comes in the form of a EAR file and a WAR file which stands for Web-ARchive which is a standard Java EE, compressed file deployment option for a JEE application server such as WebLogic, Tomcat, etc. Because it is a single compressed file composed of one or more files we can use a decompression tool to open it.
First, locate the bicustom-template.ear file from the following location on your OBIEE 11.1.1.9 server installation, <fmw_home>Oracle_BI1bifoundationjee.
Next, copy the bicustom-template.ear file to a temporary directory such as C:tmp, /tmp, etc. You may wish to create a sub-folder specifically for extracting the files in the next steps, ex: /tmp/artofbicustom/
Next, decompress or unzip the file using 7-zip or unzip commands. Example, unzip bicustom-template.ear
Next, unzip the WAR file, bicustom.war, that results from the decompression of bicustom-template.ear
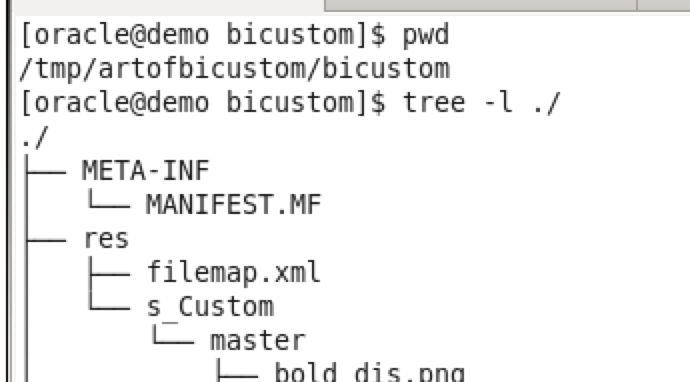
You should now have a folder structure similar to the below…
Customize the new graph.xml file for the new customization folder structure
OBIEE now maintains all core graphical customizations, logos, Cascading StyleSheet (CSS), modifications in a centralized file and folder structure. This great for modularity and works also well for when working in a High Availability environment.
For this article we will only edit the default/custom chart colors, but you can browse through the files and folders and get an idea of where else you can make modifications for your customizations.
Locate the ./res/ directory from the extracted bicustom.war file.
View the /res folder and its /s_custom sub-folder
Expand the /res/s_Custom/master folder and locate the graph.xml file. This file actually simples the process of customizing most of the graph and chart defaults. We always disliked the previous versions’ naming of the similar legacy file but this one finally makes sense.
Make a backup copy of graph.xml so that you keep the original around as a baseline.
Edit the graph.xml file and modify the Graph element section to update the SeriesItems elements, adding a new Series XML element item for each custom color in your palette.
For example:
Copy the Extracted WAR folder to the /analyticsRes Folder
In OBIEE 11g there is a folder within the OracleBIPresentationServices folder that holds the web catalog and other OBIEE artifacts called, analyticsRes. This is the defacto folder, and best practice location, for storing your custom OBIEE artifacts that need to be referenced via an application server or web server. Usually these are image files, web-based scripting files such as JavaScript, and other logic that can be dynamically rendered as content via the WebLogic server. For the sake of using best practices, copy the entire /res folder from the path in your temporary location from the previous steps to the existing /analyticsRes location within the Oracle Fusion Middleware Home location.
For example, copy the folder /res, in the path C:tmpartofbicustom, and the paste the /res folder in the path C:OracleFMWinstancesinstance1bifoundation OracleBIPresentationServicesComponentcoreapplication_obips1analyticsRes
Example on Linux: cp -ar ./res C:OracleFMWinstancesinstance1bifoundation OracleBIPresentationServicesComponentcoreapplication_obips1analyticsRes
Deploy analyticsRes to WebLogic (if not already deployed)
As mentioned, using the /analyticsRes folder of the default OBIEE 11g implementation to store media and programmatic scripting files is a best practice. Although you could create a different folder named arbitrarily, containing a WEB-INF folder with web.xml file to denote it is a JEE deployable folder location, we recommend just sticking with something that works as a best practice. If you have never deployed the /analyticsRes application, we’ll have you jump over to the following blog post on how to do so.
Deploying /analyticsRes application directory in WebLogic
The basic steps are:
- Open WebLogic Admin Server Console and Logon with Administrator account, ex: weblogic
- Click on the left panel, Deployments option
- Click the Lock and Edit link
- Click the Install button
- Locate the /analyticsRes folder from the path, C:OracleFMWinstancesinstance1bifoundation OracleBIPresentationServicesComponentcoreapplication_obips1analyticsRes
- Click Next, and select Deploy as Application
- Click Next, and Check the bi_cluster checkbox
- Click Next, and at the bottom select I will make the deployment accessible from the following location
- Click Finish
- In the Deployments table, locate analyticsRes, check that row’s checkbox, and then click on the Start button to Start Application
- Go to the physical directory for /analyticsRes and create file there called README.txt with “Hello World!” in the file and save the README.txt file
- Navigate to the OBIEE portal, and change the URL to http://<obi_server>:9704/analyticsRes/README.txt
Update the instanceConfig.xml file for the OBIEE server
As you know the instanceConfig.xml file is at the heart of custom configurations for OBIEE’s presentation and appearance. Navigate to the config folder of your Oracle BI instance in order to edit it to point to the /analyticsRes folder location from the previous step. If coming from an upgraded system, i.e.: a minor version of OBIEE 11g to 11.1.1.9 then tho configuration may already be in place for our OBIEE system. Regardless, you’ll need to use this step of the configuration to check for the existence of the setup.
Navigate to your OBIEE instances…config folder at, C:OracleFMWinstancesinstance1configOracleBIPresentationServicesComponentcoreapplication_obips1
Make a backup copy of instanceConfig.xml
Open instanceConfig.xml for editing using Notepad++, VIM, gedit, etc.
Search for the XML tag as this is the location, below which,we will add the following syntax based on your environment’s OBIEE folder structure:
[code language=”xml”]
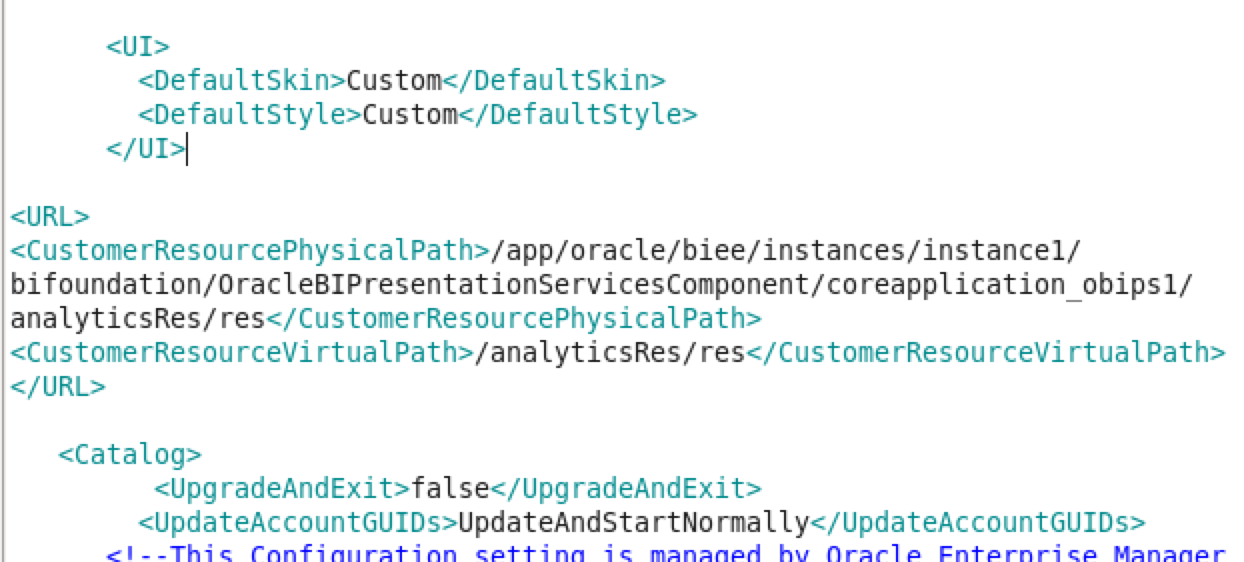
<url>
<customerresourcephysicalpath>D:OracleFMWinstancesinstance1bifoundationOracleBIPresentationServicesComponentcoreapplication_obips1analyticsResres</customerresourcephysicalpath>
<customerresourcevirtualpath>/analyticsRes/res</customerresourcevirtualpath>
</url>
[/code]
also change the values within the UI elements to state the value, Custom, as in:
[code language=”xml”]
<ui><defaultskin>Custom</defaultskin>
<defaultstyle>Custom</defaultstyle>
</ui>
[/code]
Save the instanceConfig.xml file
Restart the OBIEE Services (via OPMNCtl or Enterprise Manager)
Restarting the OBIEE services gives the OBIEE system a chance to collect itself, locate any updated file, and make sure that they are properly available at servers start. You should know how to restart the Oracle BI Services. Since we are within the OBIEE server itself conducting the restart operations usually, we will use OPMNCtl to stop and start the server while directly on the server. Alternatively, use your Enterprise Manager web-based application to stop and start the services.
Open a terminal window or command prompt.
Change directory to navigate to the folder, C:OracleFMWinstancesinstance1bin
Execute the statement, opmnctl stopall, then wait for the command prompt to return.
Execute the statement, opmnctl startall, then wait for the command prompt to return.
Execute the statement, opmnctl status, then wait to see if all components state “Alive”. If so, then OBIEE should be in working condition.
Test the new Color Palette
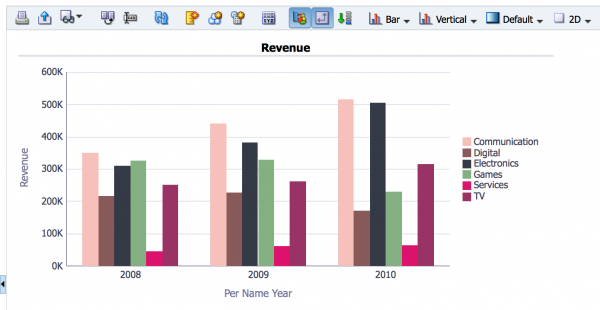
Open the BI Portal, navigate to create a New Analysis Report based on a subject area of your choosing per your OBIEE system.
Add some columns for a quick query and then click the Results tab to render results. A table is usually the default, so now add a new graph view such as a bar chart or pie chart. The color scheme should reflect the colors you’ve added to the graph.xml file. If so, then you are now a graph customization superstar and the power is with you.
References
OBIEE documentation found here,
https://docs.oracle.com/middleware/11119/biee/BIESG/answersconfigset.htm#BIESG9186
An Oracle support document found here,
https://support.oracle.com/epmos/faces/ui/km/DocumentDisplay.jspx?_afrLoop=297229488404415&id=2044573.1